Last update : 11th April 2007


… and more especially …
how can you use this information
in your project ?
how can you use this information
in your project ?
The 5th percentile mark is the point below which 5% of the population is represented in the graph, the 95th percentile is similarly the point above which the tallest 5% of the population are represented. Predictably the 50th percentile mark is the point at which 50% are below that height and 50% are above. The line down the middle in this case is the most common height found in the sample – this the ‘modal height’. Since this curve is symmetrical – the ‘average’ height is also shown at the line in the middle – so the ‘mean’ height point coincides with the ‘median‘. Of course it doesn’t always follow that the curve will be a ‘normal’ bell-shaped one – it may be ‘skewed’ to one end – if for example the distribution curve of people within a primary school were surveyed. As there would be many small children within the sample, the curve would be towards the ‘shorter‘ end. So aiming a product at a particular group of people needs to use anthropometric data such as this – before it is designed.
“Good product-design is the ability to make products that the customer wants and can use comfortably.‘ Consequently a good product might be expected to sell well since it seems to have been designed for the user who possess it.
Using this ANTHROPOMETRIC data allows the designer to create well-designed items. These well designed items will work well and be comfortable to use – and so will be ERGONOMICALLY well designed.
Let’s say you have been given the Design Brief of a small table to design – Apart from checking out the size of people who might use it – it would also be necessary to check out the ‘footprint’ of the items that might most usually be placed on it. If the table were to be a bedside tale – you might find an alarm clock; a radio perhaps; a photo maybe and space for a drink ….. So how big should the table be … ?
Apart from the features that are listed here -
that will become part of the SPECIFICATION for the product -
What other detailed factors would influence the range and general approach you would have as a designer to producing your designs ? If you are unsure then check out the section on the DESIGN CYCLE - as this covers the different considerations in the DESIGN PROCESS. Consider as many points as you think relevant when completing the
PDS - the PRODUCT DESIGN SPECIFICATION
Using this ANTHROPOMETRIC data allows the designer to create well-
Let’s say you have been given the Design Brief of a small table to design – Apart from checking out the size of people who might use it – it would also be necessary to check out the ‘footprint’ of the items that might most usually be placed on it. If the table were to be a bedside tale – you might find an alarm clock; a radio perhaps; a photo maybe and space for a drink ….. So how big should the table be … ?
Apart from the features that are listed here -
that will become part of the SPECIFICATION for the product -
What other detailed factors would influence the range and general approach you would have as a designer to producing your designs ? If you are unsure then check out the section on the DESIGN CYCLE -
PDS -


Have you ever wondered how it is that you can go into a shop and buy a shirt or a pair of shoes that fit you pretty well – when almost nobody you know is the same shape and size as you ? Well designers want to make the most of their products – they need them to be successful to survive - and so they are made with the most ‘usual’ sizes of people in mind.
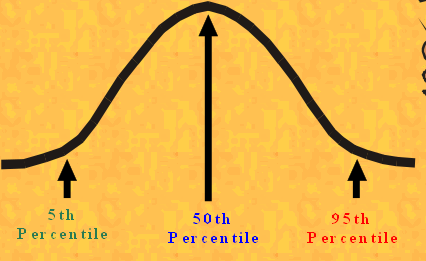
A curve like this shown here could show distribution of heights found in the population if the ranges of heights followed a ‘normal distribution curve’ (see animated demo)